Login
Shopping Cart   
Resource details
Users Rating: 0      Votes: 0      Your vote: 0
  •  
Vote:

Using ITC for comparing data

Subject: Mathematics
Grade: Upper Primary
Publisher: YDP
Resource types: Class activity
Resource ID: j979
Description:
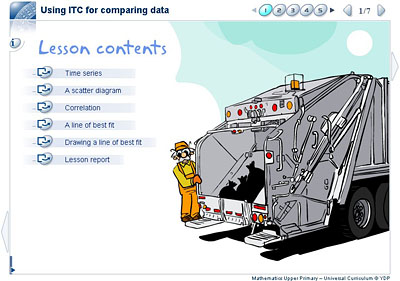
At the end of this activity, students should be able to:
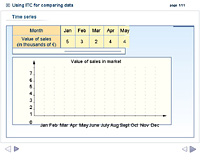
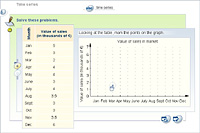
– draw a time series
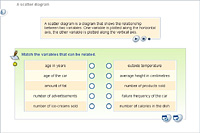
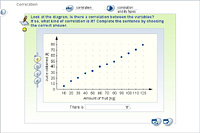
– look for a correlation based on a scatter diagram
– recognise basic types of correlation
– draw a line of best fit according to the eye.

More options

Tell a friend: 
Send  
Partner resource
Using ITC for compa...
Whiteboard presentation
Consists of...
Time series
Student activity
A scatter diagram
Student activity
Correlation
Student activity
A line of best fit
Student activity
Drawing a line of b...
Student activity
Relevant to...
Copyright
Keywords
 

Reminder notice for Free Content Creator access point

Notice

Before posting any material, please insure that you have thoroughly reviewed the Terms of Use, Privacy Policy and Children’s Information Privacy Policy and are completely familiar with the rules and obligations for submissions to Carolina Biological’s Online Services. For ease of reference, links to each of these documents is provided below.


Terms of Use
Privacy Policy
Children’s Information Privacy Policy

Continue